Jugendherbergen in Europa und im Mittelmeergebiet

Folded away in my collection of maps is a well-folded and slightly yellow youth hostel guide map of Europe, vintage 1983. Even if I hadn’t carried that map around Europe in the summer of ’83, I would know the date.youth hostel map 1983 youth hostel map 1983

It’s fairly large, 24 x 34 inches, and a little cumbersome to use except in your room, as you planned a future stay. We had guidebooks that might (or might not) mention a particular youth hostel, but there were no websites to tell you what you were getting into, though I never did stay in a bad one, just some mediocre ones. You also never knew whether it had a vacancy, unless you figured out how to call ahead, which could be an involved process. Even in the high season of summer, however, I remember that being an issue maybe only twice, and in those cases the hostel staff recommended somewhere else to stay.

One side includes most of northern Europe, including insets for Ireland and West Germany, where youth hostels were thick on the ground. But not in East Germany in those days. Guess the DDR didn’t take kindly to youth traveling around.youth hostel map 1983
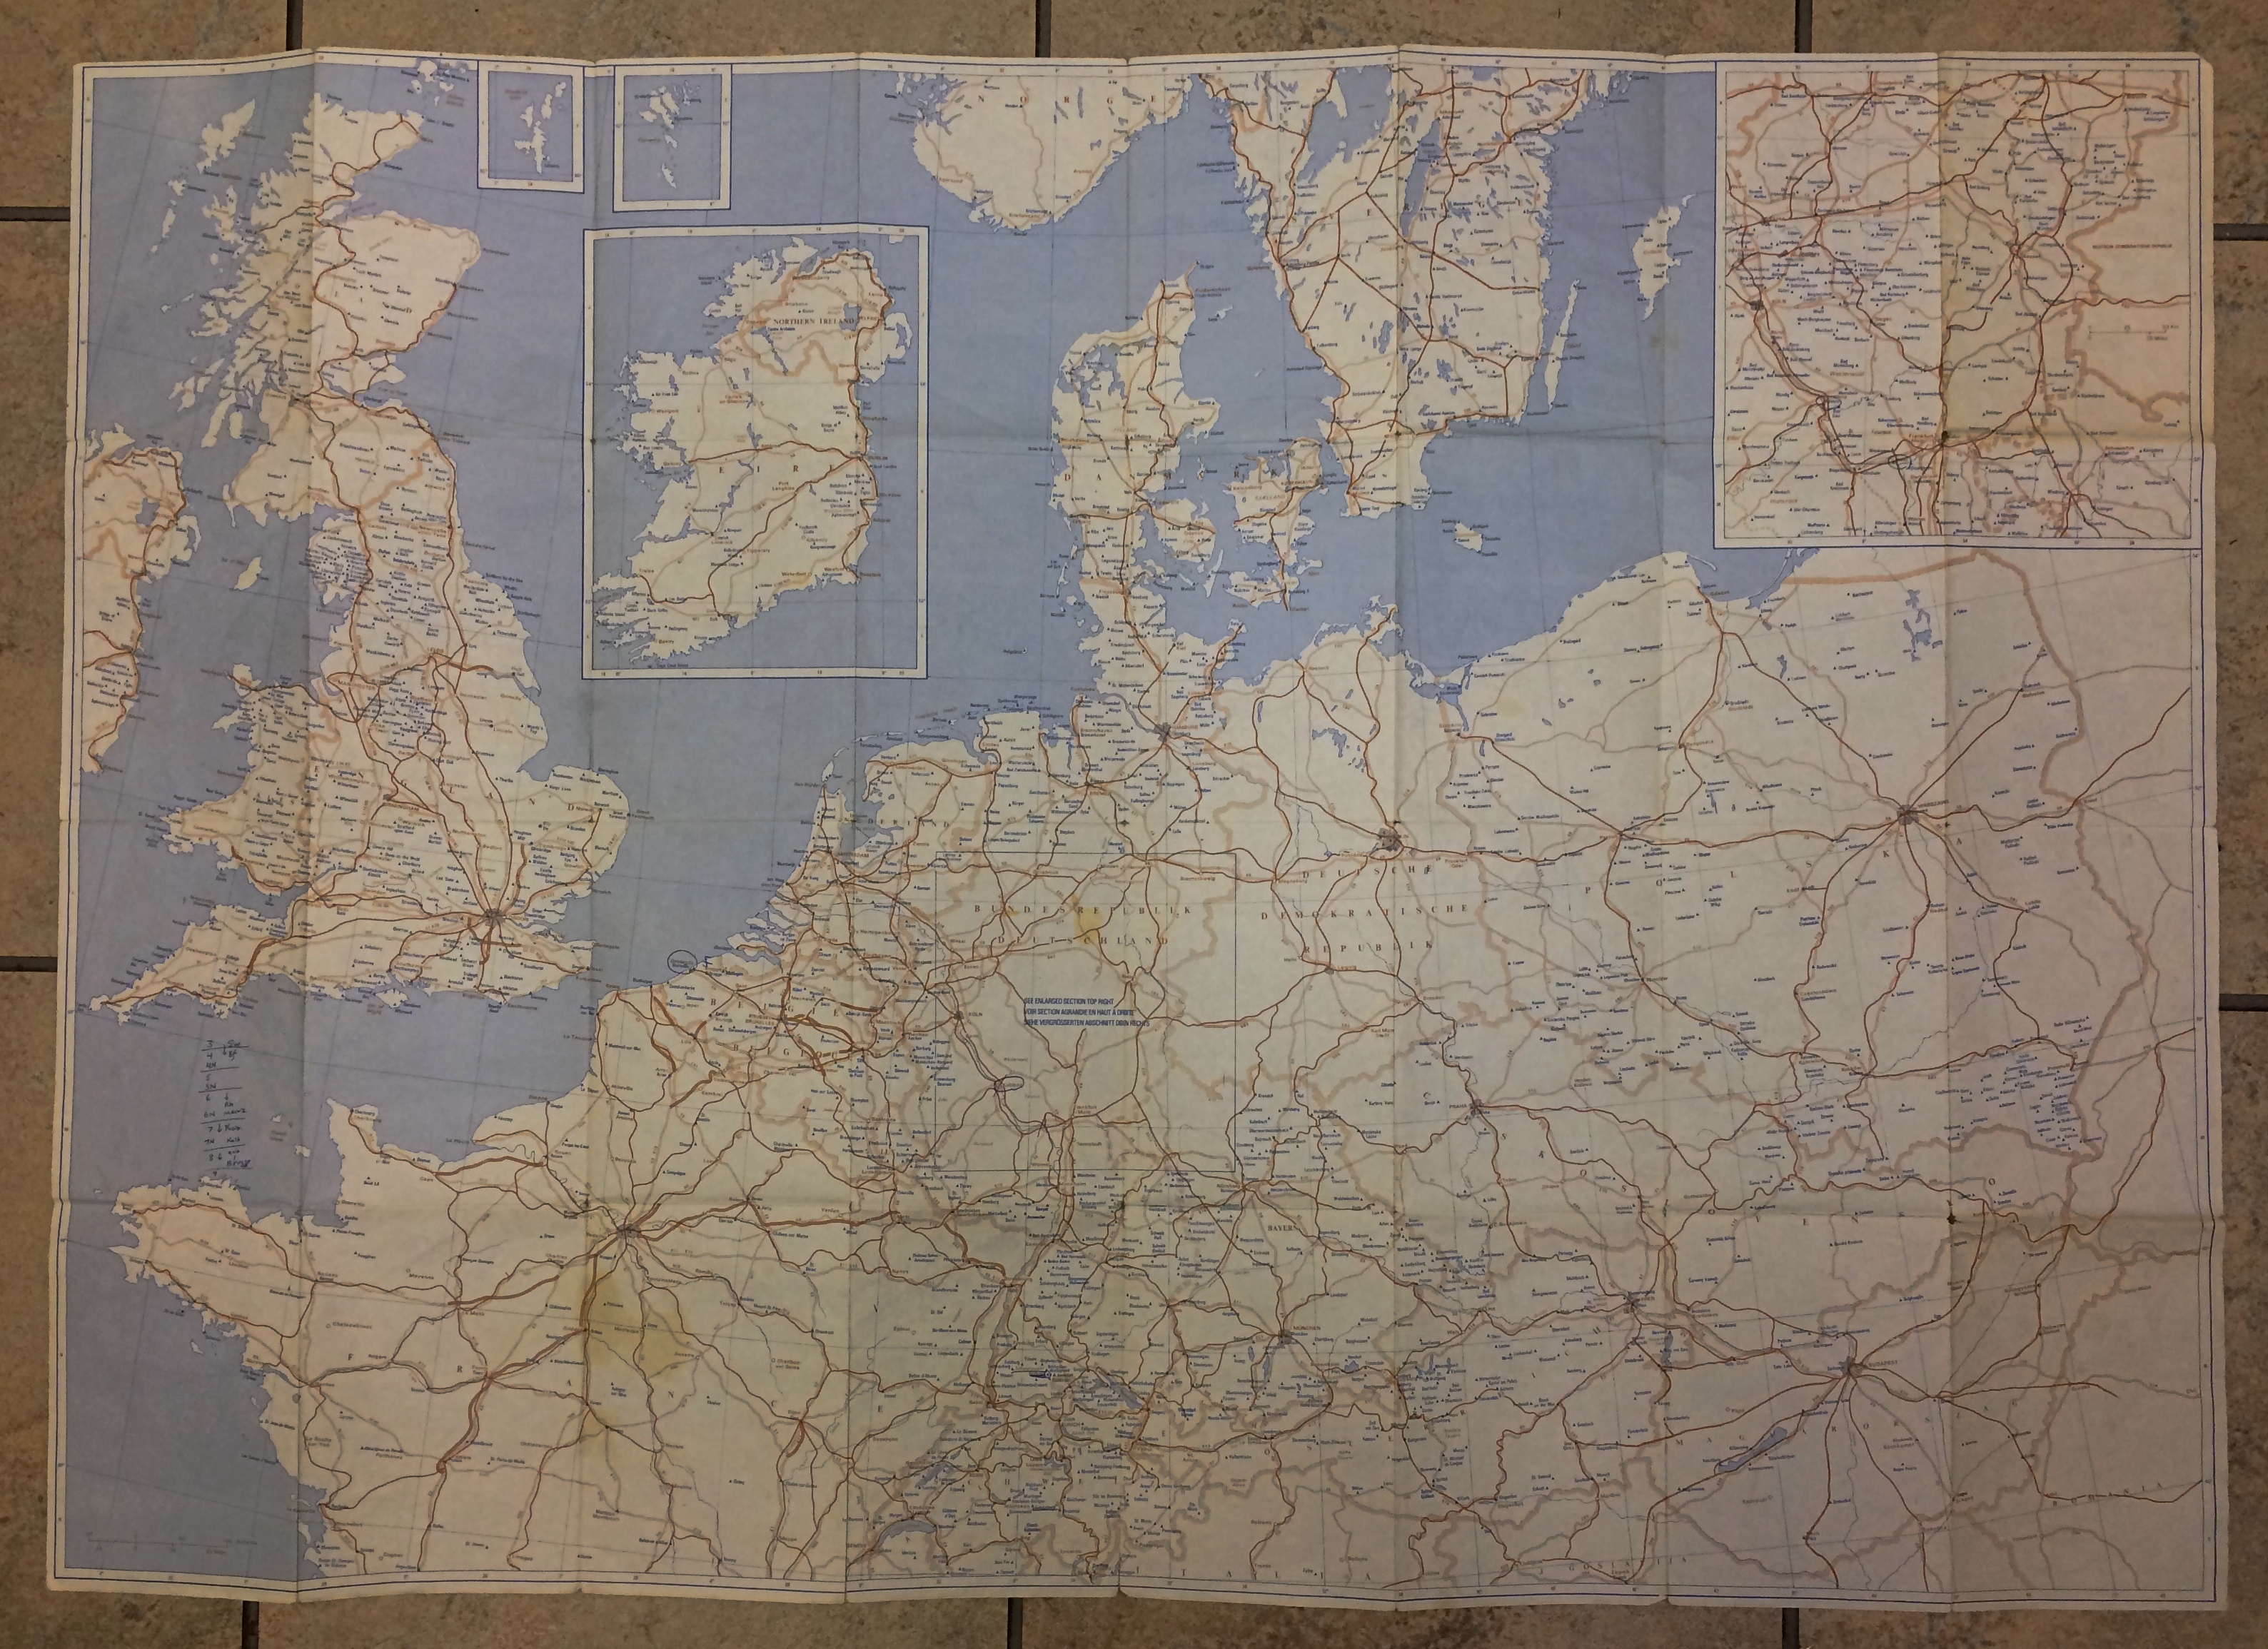
Interestingly, most of the other communist countries, at least those that weren’t the Soviet Union, had a system of youth hostels. Bulgaria seemed to have been especially fond of them. Maybe they still are.

The other side features southern Europe and northern Africa, including a fair number in Tunisia and a scattering in Morocco, Egypt and Libya, of all places.
youth hostel map 1983
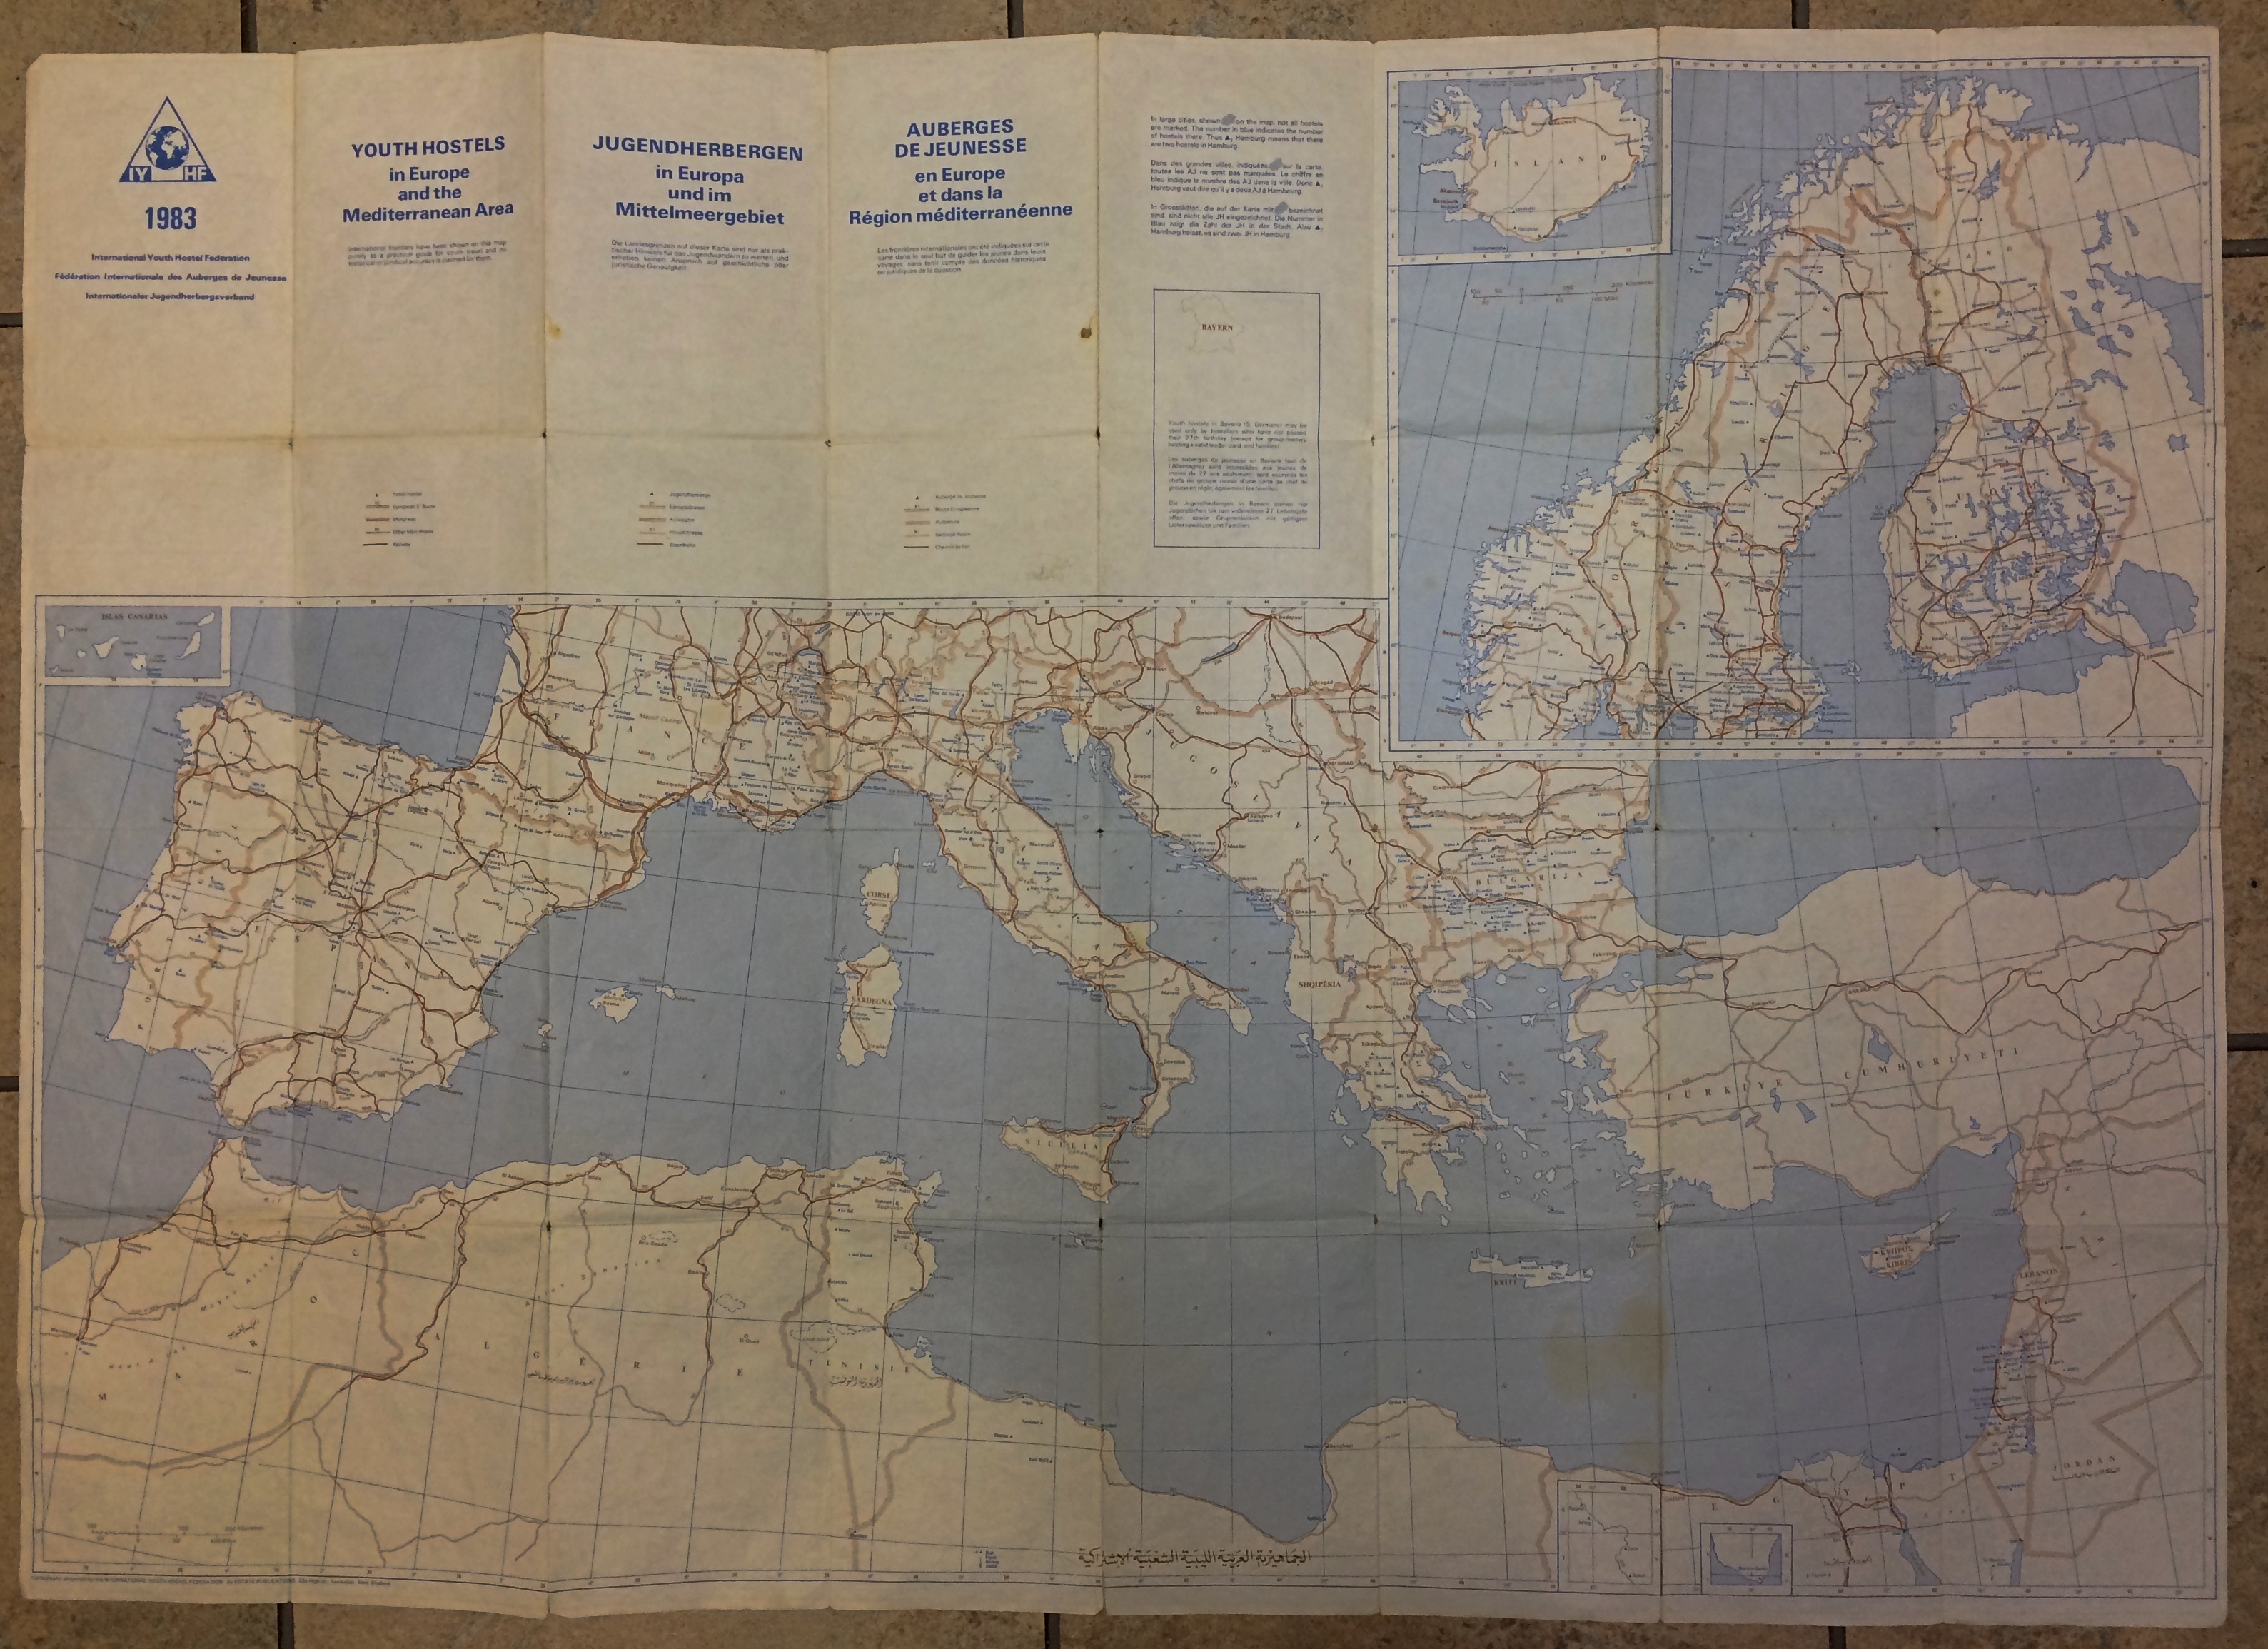
The map is relatively simple, noting national borders, some of the larger cities and roads and rivers, and each IYHF-affiliated property as a blue triangle to stand out against the browns of the rest of the map.
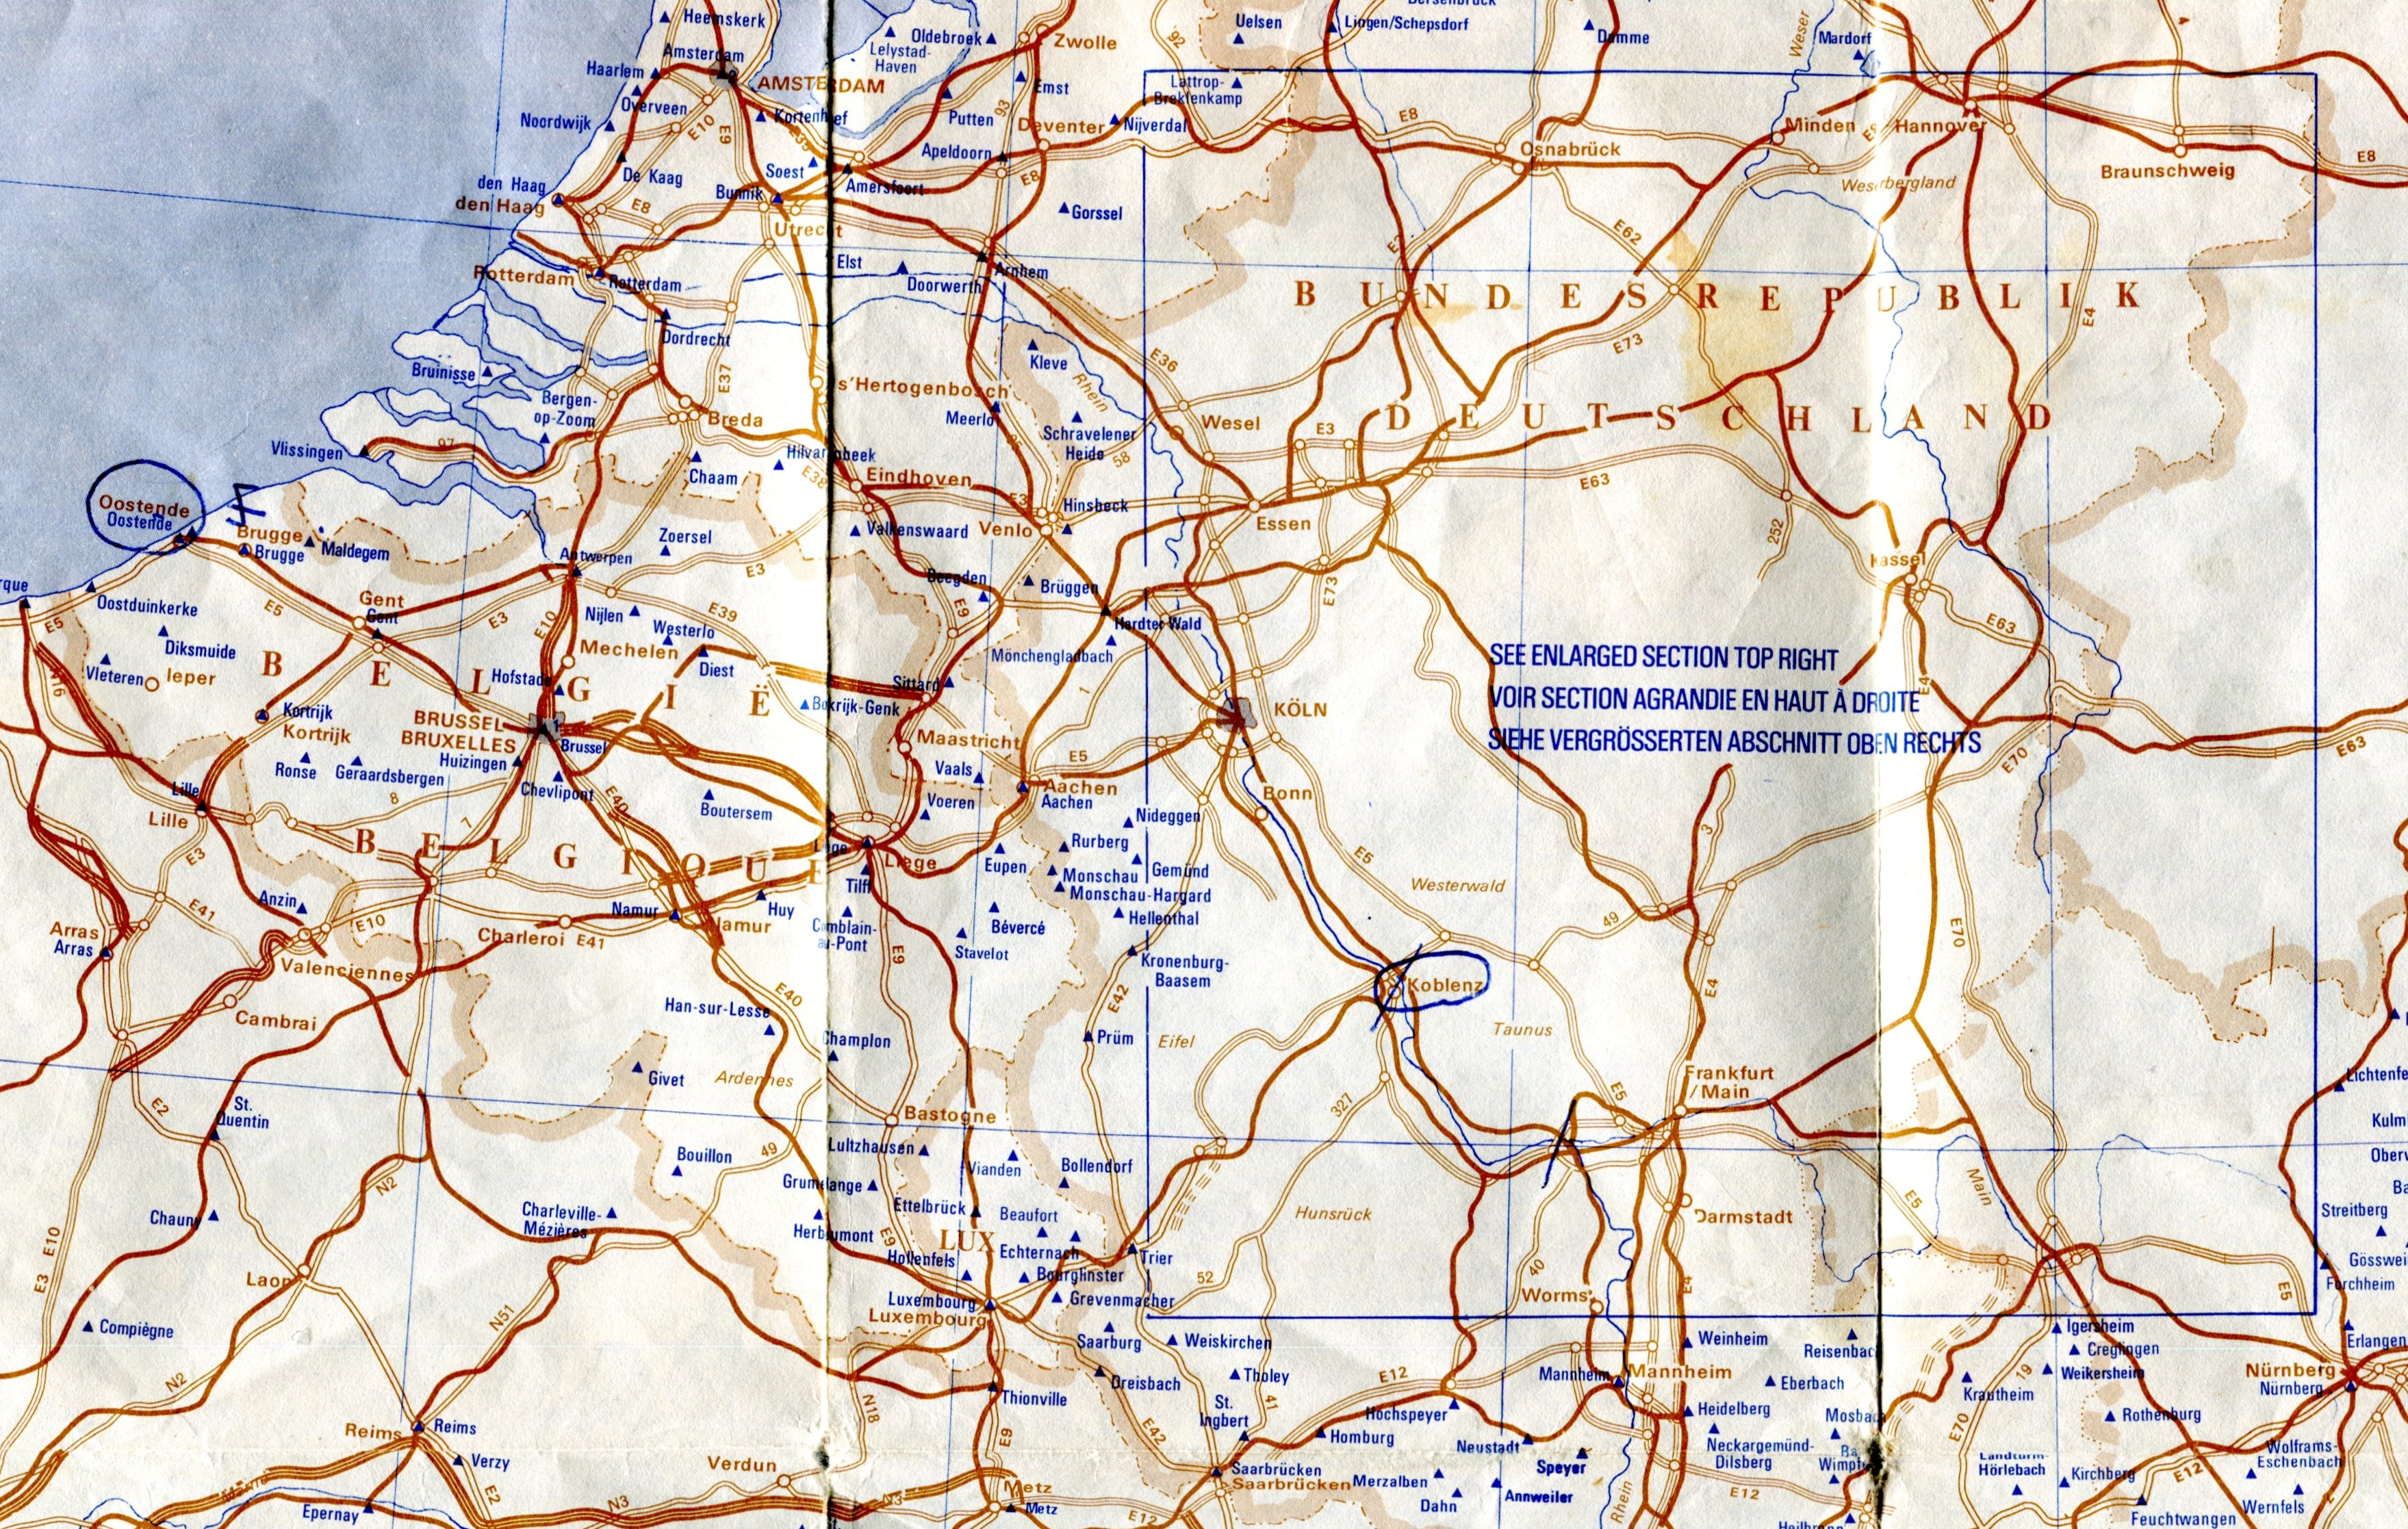
youth hostel map 1983

The German inset.youth hostel map 1983

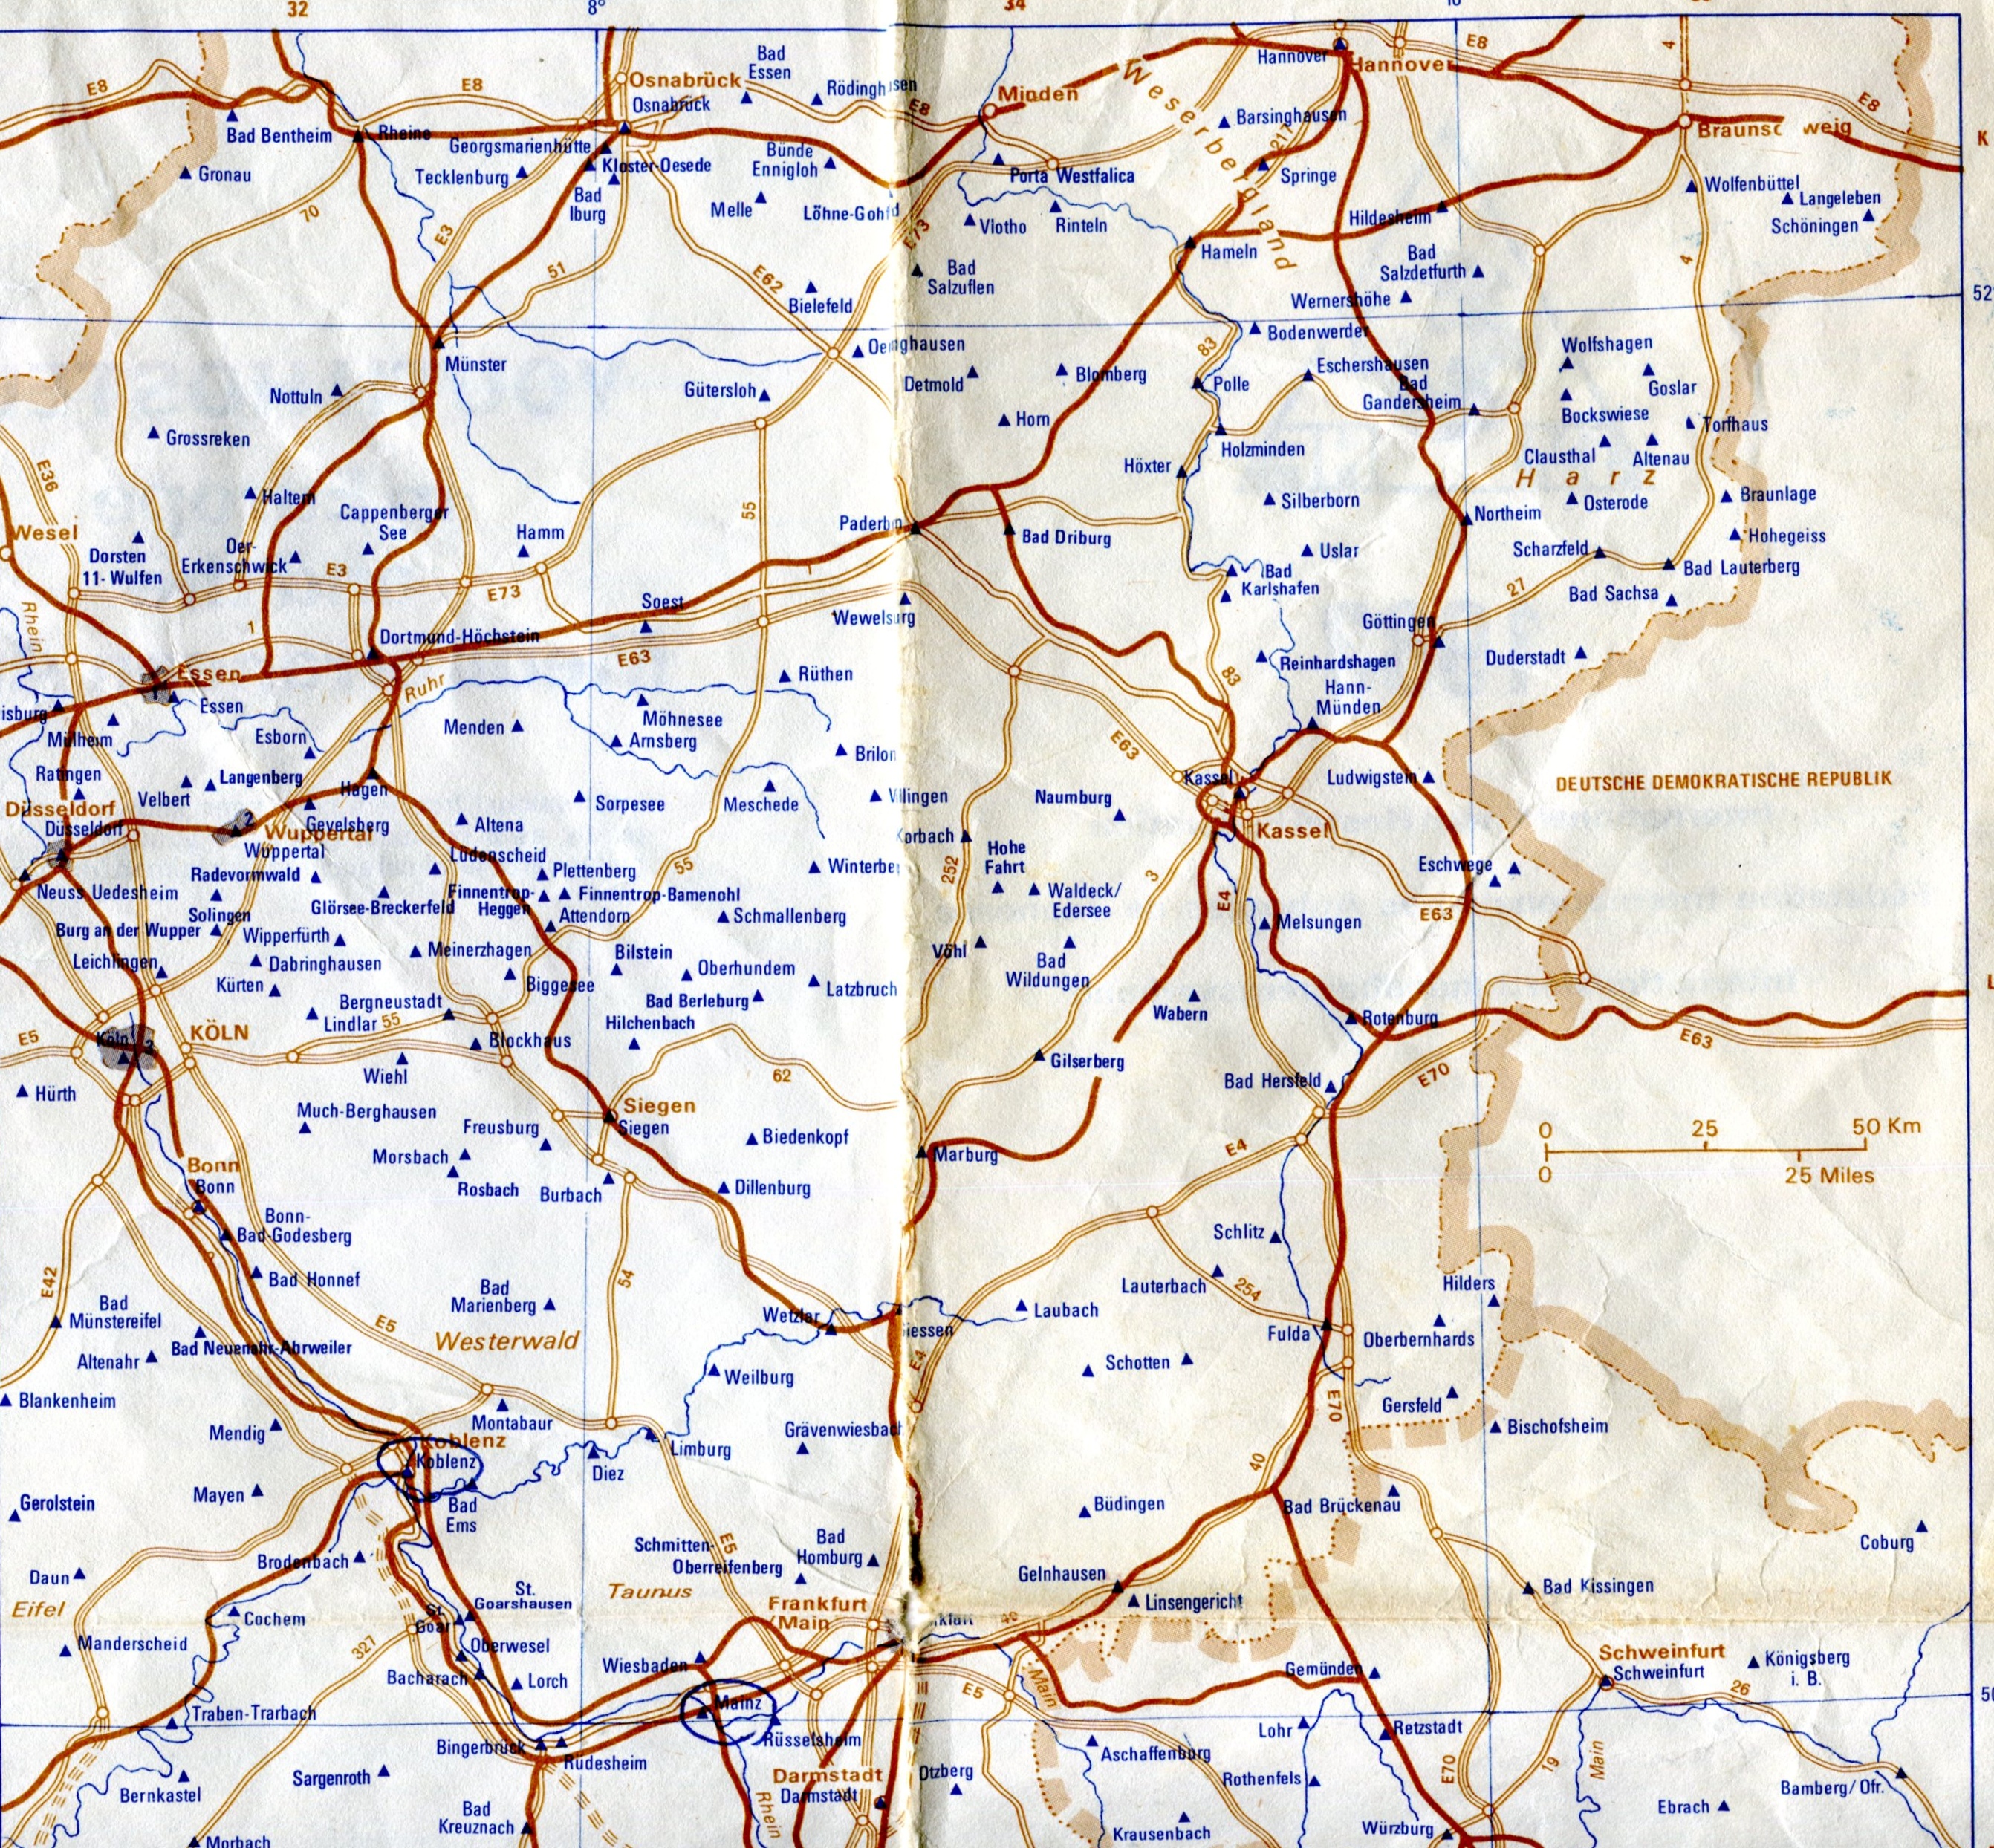
I took a few notes on the map, such as these between Devon and Brittany.youth hostel map 1983

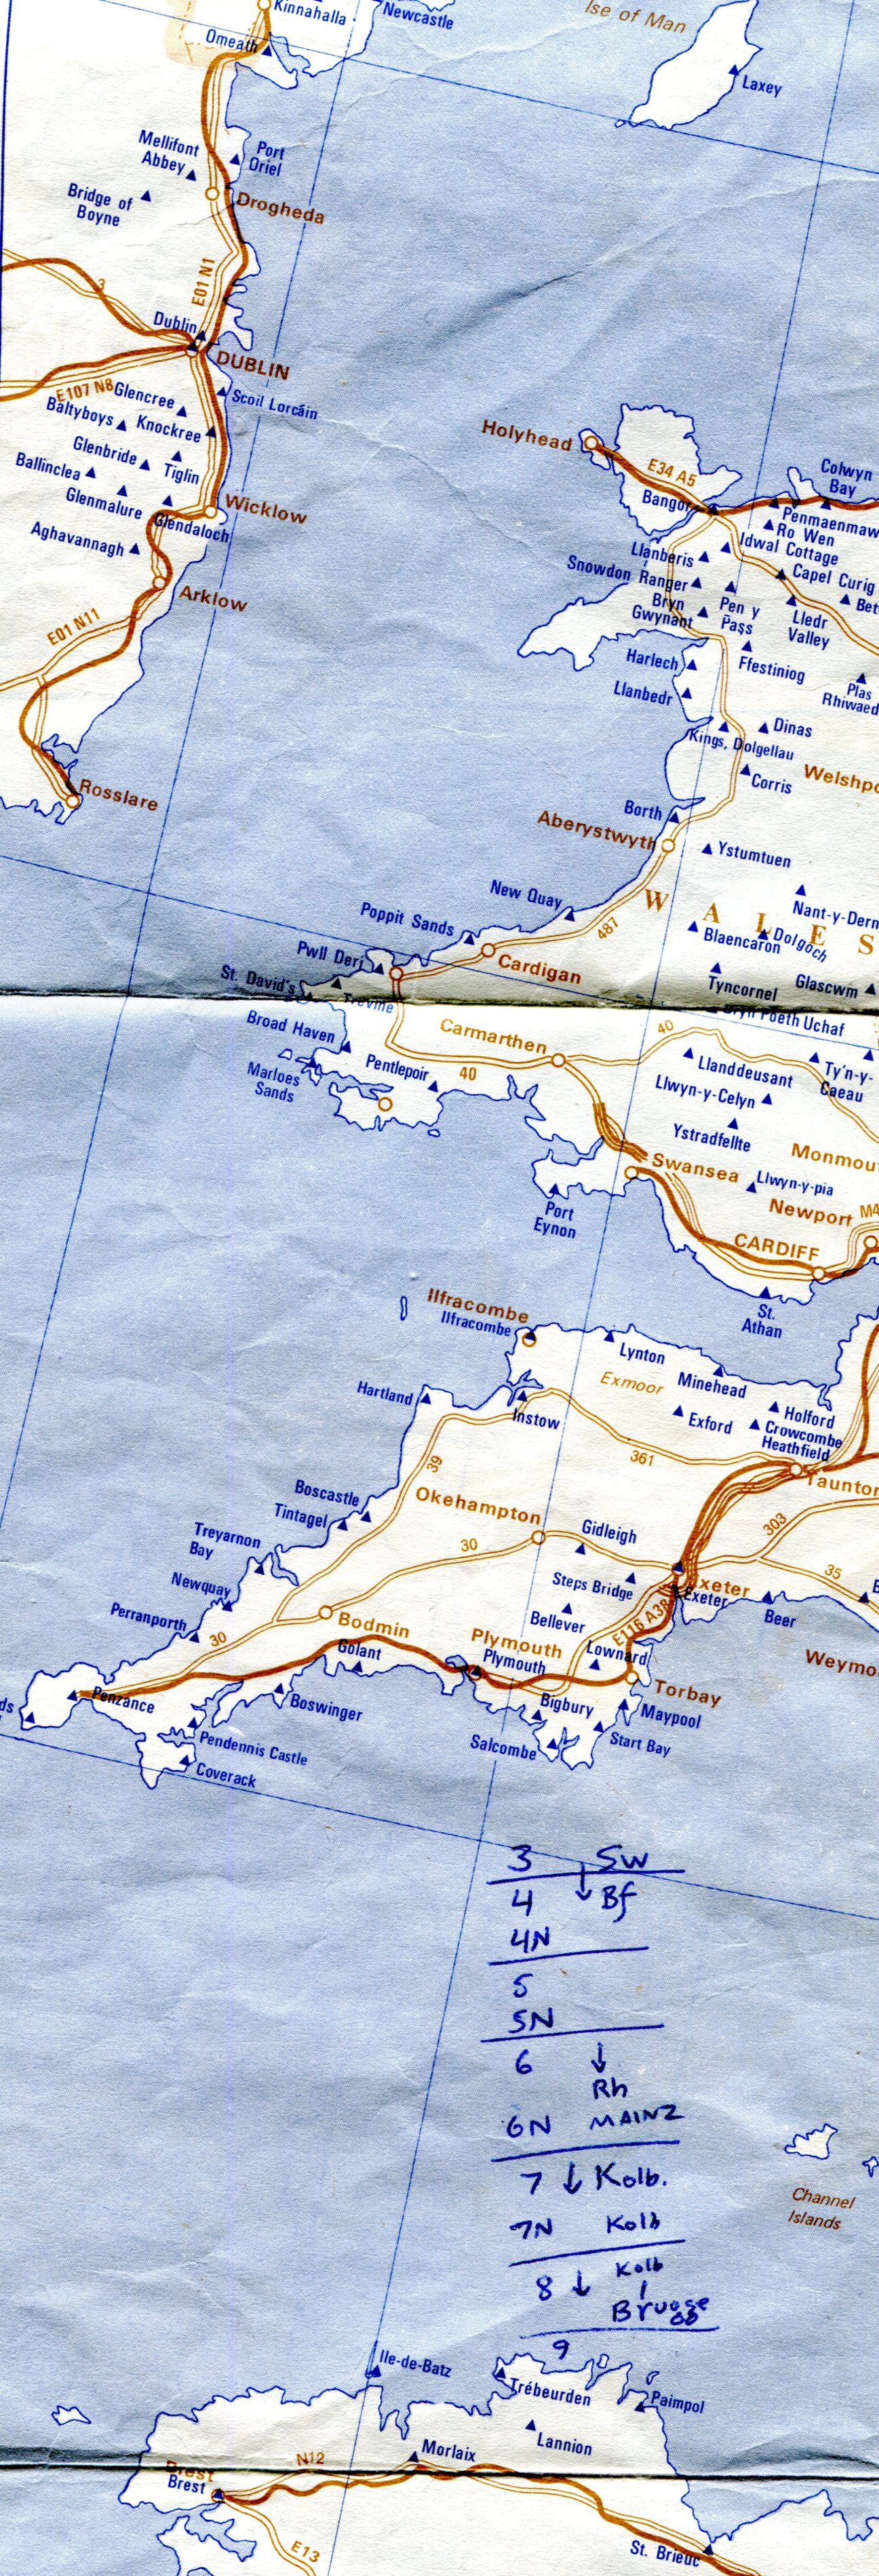
Looks like I was working out my travel schedule from August 3 to 9, as we headed north from Switzerland to the coast at Oostende. I wrote “Brugge” at the end, but for reasons I don’t remember, and can’t fathom now, we didn’t stop there.

We stayed at hostels in the UK, West Germany, Austria, Switzerland and Denmark. All the more expensive countries, in other words. In Italy, which had any number of cheap guesthouses, we didn’t bother, and sometimes the hostels we stayed at in northern Europe weren’t affiliated with the IYHF.

Across the Border

If you like maps, you’re going to have a certain fascination with borders, as imaginary and fluid as they may be. If you travel at all, you’re going to cross borders. If you have a fascination with maps and you travel at all, you’re going to be fascinated when you come face-to-face with a border.

Such as standing on state borders. Or national ones, which are harder to stand on, but not impossible.

On Saturday morning, when it was cool but before the cold rains that evening, I took a walk along a path, headed toward a border.
Higgins Road footpathActually, as you can see, the footpath was under construction, so I for 100 feet or so I followed the cut ground where pavement would soon be. Replacement pavement, since I’ve seen a path there for years. I can’t imagine it’s being replaced with anything else.

Not all of it is being rebuilt.
Higgins Road footpathSoon I came to the border. Or at least a sign, if not the precise line.
Higgins Road footpathThe Schaumburg-Hoffman Estates Border. A simple map shows how convoluted it is, an echo of a competing annexation rush in the late ’50s and early ’60s.

On the back of the sign is the Hoffman Estates seal, or emblem or logo. I didn’t remember seeing it before. Edited from the original: “Growing to Greatness, and Those Schaumburg Bastards Aren’t Going To Stop Us.”
The blue diamond marks where I was, heading west into Hoffman Estates, and then back east into Schaumburg. The road is Illinois 72, but we never call it that. It’s Higgins Road. Just to the east of the blue diamond is a small office complex that includes our dentist as a tenant. I took Ann there Saturday morning for an appointment, but there’s no waiting in the waiting room, so I hit the footpath.

“Early records date the road back to 1851,” writes Pat Barch, Hoffman Estates historian. “It was identified as the Dundee Road on 1904 maps. Early settlers called it the Chicago-Dundee Rd. Today’s Higgins Road (Route 72) wasn’t opened as a state road until 1924. It runs for 110.71 miles from IL Rt 43 in Chicago to Lanark, IL.”

Also, the road might have been named for nearby landowner “F. Higgins.” Lots of early landowners gave their names to later suburban roads. As suburban roads go, I like Higgins, at least at this juncture. It’s usually less crowded than the similar-sized and nearby Golf Road, which runs past the Woodfield Mall, car dealerships and other traffic generators.

All the years I’ve been driving on Higgins, I’d never walked on the path. Or seen many other people doing so, or riding bikes. So I guess the current crisis is good for something — getting me out to see the territory.

This is the view across the border. Not much of a change in scenery.
Higgins Road footpathHiggins to the left has some traffic, but only enough to be distracting when you’re on foot, until you start to ignore the sound. To the right are bushes and fences that separate the road and footpath from suburban back yards.

I got as far as the intersection of Higgins and Ash Road. Years ago, I used to turn on Ash to drive to the home of a babysitter we used occasionally, who had a daughter about Lilly’s age. Live in a place long enough and everywhere reminds you of something.

Handy Map of London

I have in my possession a Handy Map of London. This is supposedly a German version of similar vintage; mine is in English, but it looks just the same. Mine is dated 1986, so I’m certain I picked it up in 1988.

It isn’t my favorite map of London — that would be that marvel of aesthetic mapmaking, the Bensons MapGuide.

Still, the multi-page, folding Handy Map, published by John Bartholomew & Son Ltd. of Edinburgh, was indeed handy. That company, long since a unit of Harper Collins, is one of the storied Scottish mapmakers, as detailed here.

Interesting material in the Wiki description, though without citation: “John Bartholomew Junior was credited with having pioneered the use of hypsometric tints or layer colouring on maps in which low ground is shown in shades of green and higher ground in shades of brown, then eventually purple and finally white.

“It is his son John George who is attributed with being the first to bring the name ‘Antarctica’ into popular use as the name for the Southern Continent, and for the adoption of red or pink as the colour for the British Empire.”

By gar, someone invented those conventions. But they’re such strong conventions that you hardly think of a time when maps didn’t feature them.

The Handy Map folds out to reveal ten separate maps, nine of which are parts of Greater London, and all of which are color- and number-coded. Want to look for a particular place? The map makes that pretty easy. Even more so than Benson, I have to say.

The tenth map is a view of all of Greater London. As you’d imagine, it can’t be overly detailed, but it is good for orientation. I was looking at it the other day (for now the Handy Map is in the downstairs bathroom) and noticed an oddity on the Greater London map.

Toward the eastern edge of the map, just north of the Thames near a place called Purfleet, is a pink, long oval shape (like a race track) simply marked DANGER AREA.

What? It took me a few days to remember to check it out on Google Maps. In 1986, a danger area. In 2020, it’s the RSPB Rainham Marshes, also known as the Rainham Marshes Nature Reserve.
That would be, according to Google: “Bird-rich former marshland firing range with accessible boardwalks and a modern visitor centre.”

RSPB? The Royal Society for the Protection of Birds. The organization bought the land from the UK Ministry of Defence in 2000, opening it to the public in 2006. So danger area no more, unless you’re attacked by cetti’s warblers, little egrets or peregrine falcons. More about the marshes is here.

More about the organization is here.

“The RSPB was formed to counter the barbarous trade in plumes for women’s hats, a fashion responsible for the destruction of many thousands of egrets, birds of paradise and other species whose plumes had become fashionable in the late Victorian era,” its web site says.

“The organisation started life as the Society for the Protection of Birds (SPB), founded by Emily Williamson at her home in Manchester in 1889. The group quickly gained popularity and in 1891 it merged with the Fur, Fin and Feather Folk, to form a larger and stronger SPB, based in London.

“In its earliest days, the society consisted entirely of women and membership cost twopence. The rules of the society were:

“That members shall discourage the wanton destruction of birds and interest themselves generally in their protection

“That lady-members shall refrain from wearing the feathers of any bird not killed for purposes of food, the ostrich only excepted.”

Interesting that ostrich feathers were OK. If I felt like it, I could investigate why that was, but I have a hunch that ostrich farming was entirely too valuable before WWI to discourage, especially in South Africa. These days, leather is the main thing, with feathers just a sideline.

The Location of Wales

I have two desks in my office, both of which have drawers that are full of the debris of a home office. That includes a drawer with a lot of business cards in it. Sometimes I throw some of them out, since they date back to the early 2000s, an eon ago in the business world.

Jobs change, titles change, phone numbers change, email addresses change: all the ingredients of bum information in data bases. In some theoretical sense, my drawer of cards is an ancient analog database, but really it’s just a pile of cards. Including one with this back:

Unusual to find a map on a business card. It came with some material from the Chicago office of an organization promoting business development in Wales. It’s graphically interesting and it conveys some possibly useful information, namely that Wales isn’t that far from London or Dublin or various well-known European cities. Then again, it’s Western Europe. Nothing is that far apart in modern terms anyway.

Maybe the main reason the organization included a map is that they were tired of people saying, “Wales, huh? Don’t you guys have a Prince? Now, let’s see — I’m not sure where that is.”

Winterlude ’20

Though it hasn’t been a harsh winter, it has been winter, so time for a short hiatus. Back posting around March 1.

It turned out to be a good idea to know as little as possible about Parasite before seeing that movie, which we did last weekend, weeks after we’d originally considered going. All that time, I did my best not to read about it. Not knowing the arc of the story helped maintain the suspense, which was as riveting as anything Hitchcock did, especially after the midway twist.

I did know that the movie came highly recommended, and by sources I respect more than the Academy of Motion Picture Arts and Sciences. Could it, I wondered, be better than 1917? It was. That’s a remarkable achievement all by itself. One of those rare movies that is as good as people say.

I’ve updated my vanity North American map again.
The key to the colors is here. The color scheme is wholly idiosyncratic, so I do have certain ideas about certain places. For instance, if I spent some time in following places, I’d color the respective states blue: the Northwoods of Minnesota; Norfolk and vicinity in Virginia; Mobile, Alabama; and Tuscon, Arizona. If I spent a night in West Virginia or Delaware or Rhode Island or Manitoba, they’d be orange. Just means I need to get out more.

Though cold today, the sun was out. Time to take my new garden gnome outside.

Gnomish Stalin was a Christmas president from my brother Jay, shipped to me from the UK. Cornwall, specifically. For all I know, Cornwall might be the world hub of eccentric garden gnomes.
This year, I got Jay a Russian nesting doll — a political matryoshka doll, made in Russia. He sent me a picture. Nice set, though you’d think there would be room for Khrushchev at least, whom I’d pick for inclusion over Yeltsin.
Coincidence that we both sent Russian gifts — political Russian-themed gifts, no less? Or synchronicity? Who knows, I’m just glad to have a new conversation piece for my summertime visitors.

Australia Day, Bush Fire Edition

Australia Day has come around again, but it doesn’t seem fitting to post pictures of me standing near wallabies in New South Wales or recalling how they call Rice Krispies Rice Bubbles in Oz or my Christmas Day walk around in Canberra in a T-shirt.

Seems like one damn thing after another for the Lucky Country this year. Some choice recent headlines:

“Australia’s Wild Weather: First Fires, Now Baseball-Size Hail” — New York Times, Jan. 20

“Australia Rains Bring Relief From Fires — and a Surge in Deadly Spiders” — Smithsonian, Jan. 24

“Coronavirus: first Australian case confirmed in Victoria as five people tested in NSW” — The Guardian, Jan. 24

“Record 81 days of bad air quality in Sydney” — Sydney Morning Herald, Jan. 24.

Curious, I took a look at the web site of NASA’s Fire Information for Resource Management System, which (as it says) “distributes Near Real-Time (NRT) active fire data within 3 hours of satellite observation from both the Moderate Resolution Imaging Spectroradiometer (MODIS) and the Visible Infrared Imaging Radiometer Suite (VIIRS).”

Took a screenshot of the Fire Map of Australia on the site as it appeared on Friday. Fires in the previous 24 hours, it says.

I can see why the air is bad in Sydney and why parts of Canberra — which is a small city practically plopped down in the bush — have been evacuated.

Still, I’m not sure the map helps me grasp the magnitude of the bush fires. Maybe that’s not really possible. I wondered about that even more when I looked at Africa at the same time.
Looks like central Africa is burning to a crisp. But do the many points of fire denote blazes regardless of size? That way a lot of small fires — which could be entirely normal for central Africa right now — wouldn’t be a catastrophe on the order of a smaller number of much larger fires in Australia.

Another NASA page hints at an answer. First, it says, “The colors are based on a count of the number (not size) of fires observed within a 1,000-square-kilometer area.” Also: “Across Africa, a band of widespread agricultural burning sweeps north to south over the continent as the dry season progresses each year.”

I’ve changed my mind. I think I will post a picture of wallabies. In hopes that better times are ahead for Australia.

Pebbly Beach NSW Dec 1991

December 1991: We’re feeding wallabies at Pebbly Beach on the NSW coast, which was damaged by fire recently, according to local reports. The other fellow is Peter, a friend I stayed with for a while in Canberra. Lost touch with him long ago; hope he’s well.

Time Flies, Things Change

Something I found today in the usual way, by not looking for it. Best to look at it full screen. After a moment the details sharpen up and wow.

In only one viewing I didn’t notice any obvious mistakes, though the thing is quick and a creation of this detail must have some. And certainly you can quibble about the difference between an “advanced culture” and an “embryonic civilization” and an “advanced civilization.” What’s history for if not to quibble over?

None of that matters. It’s fascinating to watch. It’s as if the wonderful Historical Atlas of the World came to life and with much more detail (and a soundtrack).

Just from one go-around, a few takeaways. As far as the ancient civilizations of the Near East are concerned, for example, the Romans are just a bunch of Johnny-come-latelies. As anyone from Europe would be.

Then there’s the Mongols. I know about their meteoric rise, but to see the Mongol presence on the map expand like a balloon attached to a helium tank makes it all the more impressive. No wonder it’s Chinggis Khaan International Airport.

Also, note the world population count — an educated guess in all pre-modern times — in the 14th century. Down it goes with the arrival of the Black Death.

This map must represent a lot of work. Whoever Ollie Bye is, I applaud his efforts.

The Newberry Library Map Mural

I’ve read that the first floor of the Newberry Library on the Near North Side of Chicago is newly renovated, and it did have a newly polished look when Ann and I were there on Saturday. But it’s been a while since I’ve been inside the library, so I don’t really remember what it used to look like.

I’m sure that I’d never seen this intriguing mural before, which is above the landing between the first and second floors near a back entrance to the building.
A map mural. Even better, an historic map mural, along with a train at a station under the map and what looks like a telephone and telegraph office in a balloon off to the side.

The mural looks new, so either it is, or maybe an older image was expertly refurbished. I didn’t see any signs or plaques nearby to tell me which, or who the artist is, and the library web site doesn’t seem to say, so for now I’ll let the matter rest. It’s always good to find a map mural.

My guess is that the map depicts the nation ca. 1900 — united by rail, telegraph and the still fairly new telephone, with a new century of progress to look forward to. Or possibly 1887, when the Newberry was founded, or 1893, when the current building opened.

Though not cartographically precise (West Virginia looks especially mashed), the map’s close enough to evoke the United States of the period. One detail I noticed was that South Dakota’s towns were Deadwood and Yankton, even though the territorial capital moved to Bismarck in 1883 (presumably Al Swearengen would then refer to those “c—suckers from Bismarck” rather than Yankton).

Also, note the pre-land boom, pre-drain the Everglades, pre-Disney, pre-Florida Man Florida.
A little fuzzy, but it’s clear that there’s no Miami and no Orlando.

Also, the states depicted were not quite all states at the beginning of the 20th century. Arizona, New Mexico and what became Oklahoma were still territories.

That would be my only quibble: before it became a state, Oklahoma was actually two territories, the Oklahoma Territory and the Indian Territory. The Indians of the Indian Territory wanted to be admitted as the state of Sequoyah, but Congress wasn’t having it, and so the two territories were joined to form the modern state in 1907.

How do I know that the map doesn’t depict borders sometime after 1907? Because of the depiction of Canada.
The wonderfully named Assiniboia was a district of the NW Territories, as were Saskatchewan and Athabasca, all before 1905 (Keewatin was a separate territory before 1905, then became a district of the NWT). A major reorg of prairie Canada was done in ’05, making it look mostly like it does now.

So the map depicts pre-1905 Canada, but post-1907 Oklahoma. Ah, well. It’s small quibble about such a fine example of a mural.

The American Geographical Society Library (Or Wow, Look at All the Globes!)

At the University of Wisconsin-Milwaukee’s Golda Meir Library, which is the school’s main library, it isn’t hard to find a bust of the fourth Prime Minister of Israel. She was an alumna of the university’s predecessor institution, Milwaukee State Normal School.
Behind the bust is a mounted Milwaukee Sentinel article, dated August 27, 1987, about the sculptor, Maurice Ferstadt, whom I’ll give credit for not trying to idealize the prime minister’s face. On the morning of February 19 of that year, Ferstadt — who was 75 –finished the sculpture. That evening, he died of an aneurysm.

Part of the library participated in Milwaukee Doors Open last weekend. Special Collections is on the fourth floor. We spent some time there, looking at some of the old and rare books on display. Interesting.

Then we went to the third floor, which is home to the American Geographical Society Library.

The closer I got, the more excited I felt. That’s not a verb I use much in my well-established middle age. But as soon as I entered the library, that rare feeling came over me. This is best thing ever!

You know, that kid on Christmas morning feeling. The giddiness passed, of course, but I remained vastly impressed by the collection all the same.

According to the library’s web site, it “contains over 1.3 million items supporting instruction, research and learning. The collection is global in scope — ranging from the 15th century to present — and includes maps, atlases, books, periodicals, photographic and film media, and geospatial data.”

And I have to add, globes. Look at all the globes! That’s what we looked at most, though there were some fine maps on exhibit too. Old globes, new ones, globes in various languages, small orbs, much larger ones, thematic globes, and globes of the Earth, Moon, the Skies and probably Mars and some other planets that I missed.

What a beaut: a geological globe.

Here’s a relief globe, made in Italy ca. 1950.
I could have looked at and taken pictures of globes all day. Here’s one more. The granddaddy of all the globes in the collection.
The Library of Congress says, “In 1942 in the midst of World War II, U.S. Army Chief of Staff Gen. George C. Marshall sent a large globe to both President Franklin Roosevelt and Prime Minister Winston Churchill as Christmas gifts from the U.S. Army. The U.S. Office of Strategic Services had compiled the maps, and the Weber Costello Co. constructed the globes. It is reported that 12 to 15 of these globes were produced between 1942 and 1955.

“The globe measures 50 inches (127 centimeters) in diameter, 13 feet in circumference, and reportedly weighs 750 pounds. It consists of two interlocking halves made of bent bands of wood over which the printed paper gores are pasted.”

One of the library staff confirmed to me that this indeed was one of those 12 to 15 globes — though not either of those given to Roosevelt or Churchill, since they are at Hyde Park and Chartwell, respectively.

In recent years, the American Geographical Society’s had its globe refurbished. Looks good for its age, I’d say.
As I mentioned, there were maps on display from among the library’s vast collection, laying flat on tables for a convenient look.
There were all kinds of maps, such as one of the rayon acetate (silk-like) escape maps that helped Allied POWs escape during WWII, highway maps, non-English maps, space maps, hobbyist maps, historical trend maps, and comedy maps, such as the MAD Pictorial Map of the United States from 1981, with artwork by the inimitable Sergio Aragonés (who’s still alive).

As fun as that was — and I spent several minutes looking at it, since any Sergio Aragonés work is going to be incredibly detailed — my favorite was a Swiss map: Die Eroberung des Weltraums.

Or rather, a schematic depicting the progress of space exploration as of the publishing date in 1968. Here’s a detail.

Not shown in my detail are the Moon, or Venus and Mars, though spacecraft had voyaged there by ’68. There had been no exploration of the outer planets or Mercury yet, so those weren’t depicted at all. What a remarkable lot of information the artist, whose name I don’t have, was able to pack into the image.

Still in Old Assenisipia

I was looking in a seldom-looked at file of images the other day and found a scan I’d made of a page from a collection of Thomas Jefferson’s writings. I’d forgotten I’d made ir. Here it is.

Nearly 15 years ago, I wrote: “Some years ago, I read a curious little document by Thomas Jefferson, who in 1784 made a report to Congress — the Congress under the Articles of Confederation — about how to create states from the Northwest Territory and what to call them.

“Jefferson suggested 10 states for the area that now contains six (Illinois, Indiana, Kentucky, Michigan, Ohio and Wisconsin). It was an exercise in hyper-rationality and hyperliteracy, though if his suggestions had been used, they would be normal and even venerated names — such is the power of custom.

“Hyper-rational because, instead of paying attention to natural features, Jefferson cut the district into rectangles measuring two degrees of latitude north-to-south and roughly four degrees of longitude east-to-west (‘roughly’ because the irregular Mississippi River forms the western boundary of the territory).

“Besides the Mississippi, geographic form did intrude in what we call lower Michigan — even Jefferson wasn’t going to ignore lakes Michigan and Huron in drawing lines — as well as a few other places on his map, but he was doing his best to apply Longitude and Latitude to the new states’ boundaries. It was as if Colorado- and Wyoming-shaped states were to be created in the Midwest.”

Naturally, other sites discuss this odd collection of non-realized states, such as (of course) Strange Maps.